On-chain Analysis: A Bird-Eye View of the Blockchain
Published Date: 19 Sep 2024
A contemporary framework for evaluating crypto markets
Throughout history, data has played a pivotal role in enabling investors to make well-informed investment decisions. The traditional financial market environment is characterized with complexity and constantly changing trends. But with the aid of proper analysis, data has become an essential tool for traditional investors to gain valuable insights into market trends and stock performance.
The finance industry has become more reliant on data, with market participants leveraging the power of data to stay ahead of the curve, gaining a competitive edge over their competitors. This use of data culminates in an evidence-based approach, leading to more accurate predictions and better decisions. However, the challenge with traditional business analytics is that market data is not always transparent.
Blockchain technology offers a more open and accessible approach, unlike the typical pattern where large tech companies harness significant amounts of users’ data and utilize it for their own benefit. The transparent nature of blockchain puts an end to this monopoly, as anyone can access and analyze blockchain data, providing valuable insights into the market and opening up a new paradigm for investors when analyzing crypto markets.
What is On-chain Analysis?
On-chain analysis is also referred to as blockchain analysis. Simply put, it is the process of analyzing and visualizing data that is stored on the blockchain. On-chain analysis stems from the core attributes of blockchain technology; immutability and transparency. Thus, a basic knowledge of how blockchains work is a prerequisite to understanding on-chain analysis.
Blockchains are cryptographic distributed ledgers that are immutable and decentralized. This immutable, distributed ledger is auditable by every network participant (nodes), and they work together to maintain and validate the transactions. Every transaction on the network is recorded on a public ledger securely and transparently. As such, anyone can view the transactions that occur on the blockchain in real-time.
That raw, unfiltered truth of what's happening on the blockchain is referred to as on-chain data. It refers to information about transactions that are processed and recorded on blockchain networks.

In essence, on-chain analysis involves watching the flow of money on the blockchain to spot potential opportunities. This is uniquely pivoted towards crypto markets as it is the only asset class where every action on the network is recorded on a public ledger from which every activity can be extracted. The value of on-chain analysis is massive because it gives a bird-eye view on what happens on the blockchain, leveling the playing ground for all parties — Institutions, retail investors, companies.
How to Access On-chain Data
On-chain data lives on blockchain explorers like Etherscan. The explorers allow users to search/query a variety of information related to a blockchain. However, on-chain data requires extraction and processing into convenient and visualized formats. The demand for this data has led to the emergence of a variety of on-chain analytic platforms that help convert blockchain data into visualized insightful charts and dashboards for investors, providing insights into market cycles, network usage and investor behavior.
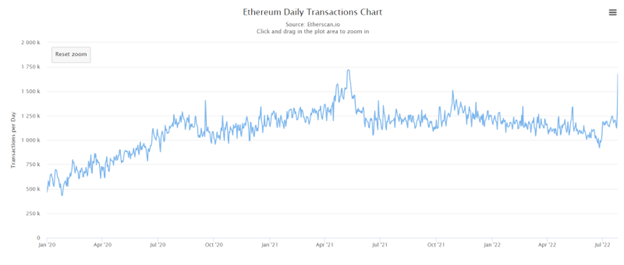
Source: Etherscan
Examples of prominent data visualization platforms include Nansen, Dune, Arkham, Glassnode, Santiment, to name a few.
On-chain Analysis Vs. Technical Analysis
Technical analysis (TA) and fundamental analysis (FA) have always been the de facto standard for evaluating crypto assets since the early days of crypto. It involves studying historical price and trading volume data to identify patterns, trends, and signals that can help predict future price movements. However, thanks to the wealth of data available on blockchain networks, on-chain analysis has emerged as a new paradigm.
While technical analysis focuses on historical data, on-chain analysis focuses on real-time data recorded on the blockchain network, making it less susceptible to manipulation. Hence, on-chain analysis is a more comprehensive and reliable way to analyze cryptocurrency markets than technical analysis.
On-chain Metrics on DeFi
On-chain analysis consists of various on-chain metrics, such as active addresses, transaction volume, supply distribution, and total value locked (TVL) in relation to the price action of an asset, daily active users (DAUs), monthly active users (MAUs), daily active addresses, to name a few. This piece does not cover all these metrics extensively. We will only focus on those that we’ve found to be particularly informative.
Total Value Locked (TVL)
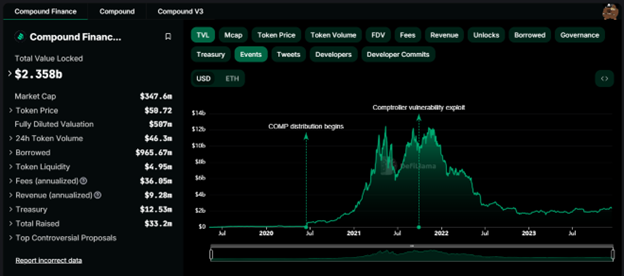
Total value locked (TVL) is one of the most common on-chain metrics. It represents the total value of crypto assets locked in a smart contract in a specific protocol. A high TVL implies a healthy platform. Tools like DefiLlama can be used to check a chain's TVL and how it compares against the rest of the market.
The image below is a screenshot from DefiLlama, it shows Compound’s TVL over time, with notable events shown on the chart:
Exchange flows
Exchange flow is another important metric that can be tracked on-chain. It gives investors insight into the overall holder sentiment of a particular crypto asset. In essence, exchange flows can help investors measure the extent of sell- and buy-side pressure.
For instance, when tokens are moved onto a centralized exchange, in most cases it’s an indication of wanting to sell them. Conversely, tokens are sent from an exchange into self-custodial wallets, it is an indicator of wanting to hold in the medium to long term. Of course, there are exceptions to this, but it is a pattern that has played out in many instances. Nansen has a dashboard that tracks exchange flows on its platform.
Wallet Balances
Wallet addresses are important in understanding whether the rate of adoption and usage of crypto assets is increasing or decreasing over time. For instance, analyzing the wallets that hold Ethereum (ETH) will give insight into whether usage of the Ethereum chain is increasing or decreasing. It reveals accumulation or distribution patterns among ETH investors.
Following the smart money
Wallets tagged “smart money” refer to wallets of prolific traders with sterling trading or investing track records, or any capital that is controlled by professional investors, institutions and funds.
The reason these wallets are tagged "smart money" is because they have been repeatedly profitable and belong to people who have a better understanding of the crypto markets than others. On-chain analytics allow investors to watch the best and, if desired, copy their every move.
Conclusion
Without a doubt, on-chain analysis is a crucial aspect of successful cryptocurrency investing and one that emerges from blockchain technology’s core properties. There is absolute visibility on what the "best investors" are doing, and the inner workings and activity of the companies they've invested in to make more informed decisions.
Maximize your value and knowledge with our 5 Reports-in-1 Bundle - over 40% off!
Our analysts are ready to help you immediately.